About the LIFE Center
Citation Details: The LIFE Center Lifelong and Lifewide Learning Diagram

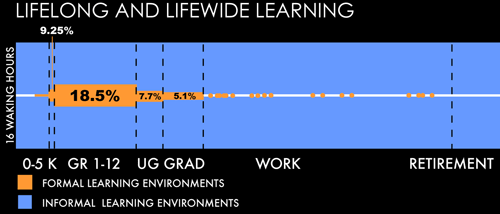
Figure 1: The LIFE Center Lifelong and Lifewide Learning Diagram
the LIFE Center's Lifelong and Lifewide Diagram by LIFE Center is licensed under a Creative Commons Attribution-NonCommercial-NoDerivs 3.0 United States License.

CITATION Details for References:
(LIFE Center: Stevens, R. Bransford, J. & Stevens, A., 2005)
LIFE Center (2005). "The LIFE Center's Lifelong and Lifewide Diagram". This diagram was originally conceived by Reed Stevens and John Bransford to represent the range of learning environments being studied at the Learning in Informal and Formal Environments (LIFE) Center (http://life-slc.org). Graphic design, documentation, and calculations were conducted by Reed Stevens, with key assistance from Anne Stevens (graphic design) and Nathan Parham (calculations).
FIGURE legend: Estimated time spent in school and informal learning environments. Note: This diagram shows the relative percentage of their waking hours that people across the lifespan spend in formal educational environments and other activities. The calculations were made on the best available statistics for a whole year basis on how much time people at different points across the lifespan spend in formal instructional environments. (Reproduced with permission of The LIFE Center.)


